Light-induced degradation (LID) and light-and-elevated temperature-induced degradation (LETID) are cell-based phenomena triggered by light exposure that should be considered in energy yield models. LID rates vary by cell technology and typically stabilize within a few days or weeks of field operation. LETID mainly affects PERC cells. Research suggests it’s a consequence of certain LID-reduction techniques applied in manufacturing and is most severe in hot climates.
LID + LETID
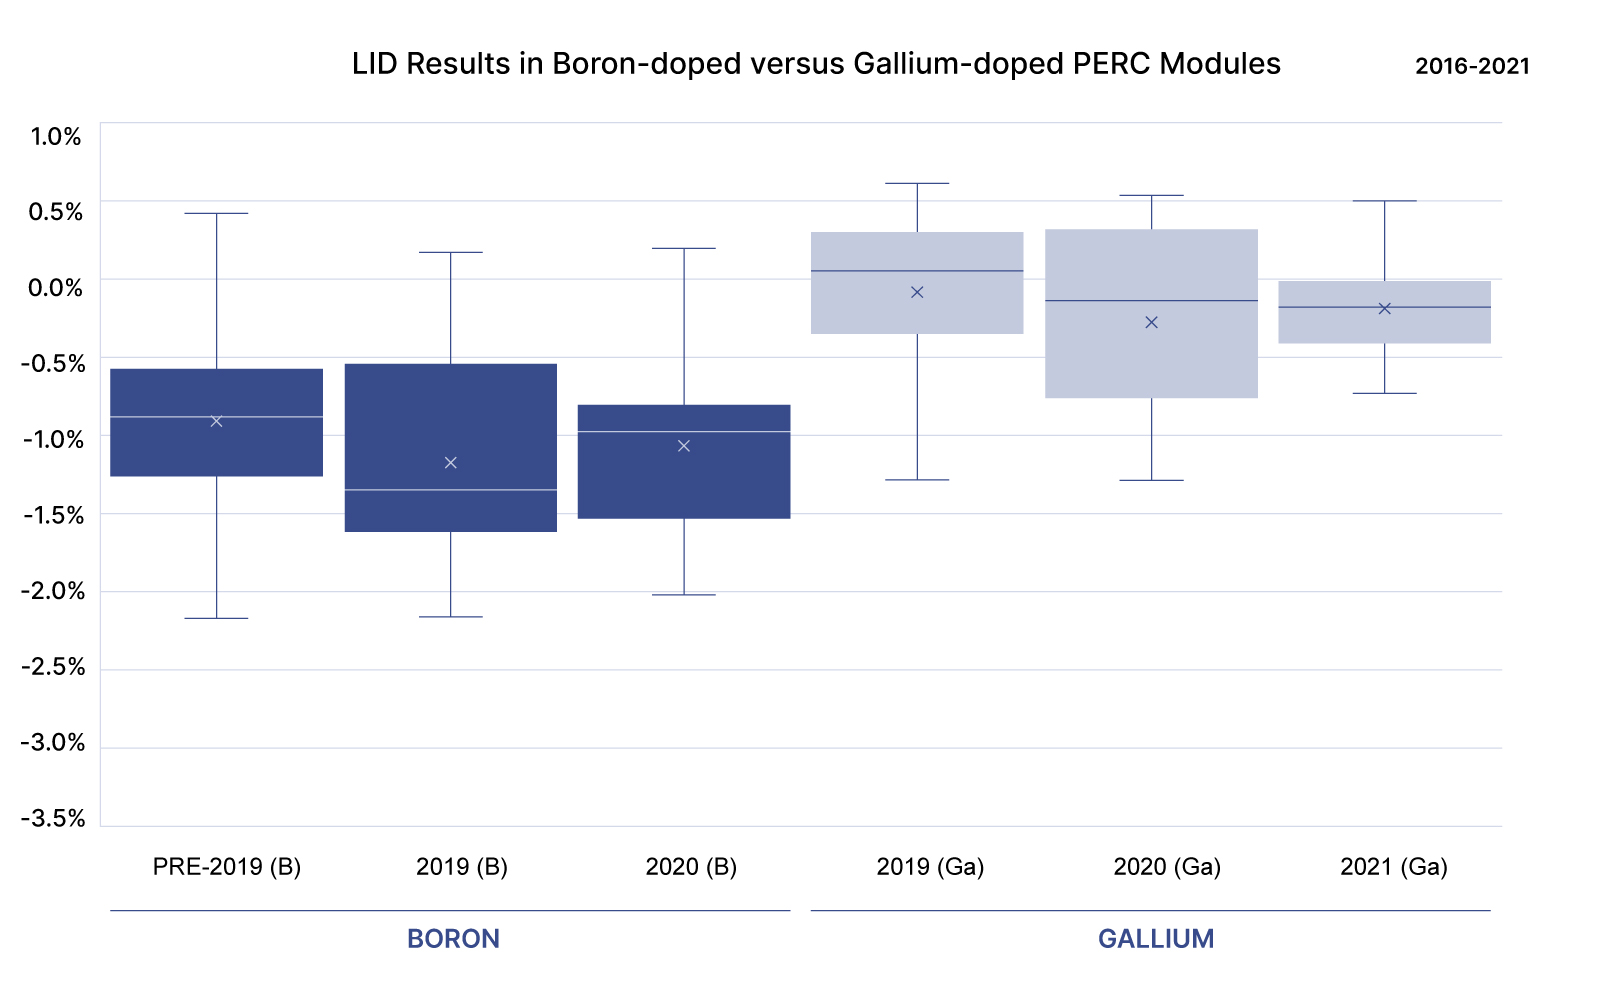
LID occurs when light exposure triggers the formation of boron-oxygen complexes in boron-doped silicon solar cells. Maximum LID power loss is usually realized within a few days or weeks following field installation. Monocrystalline p-type cells that utilize boron for cell doping can be more susceptible to LID. The industry’s ongoing evolution to p-type cells that use gallium dopants and n-type cells that use phosphorous dopants has caused a noticeable decrease in LID power loss.
LETID can affect advanced cell types, such as PERC. It occurs when cells reach temperatures over 40°C during operation. These operating temperatures occur in hot environments and in temperate regions during periods of high irradiance. Degradation from LETID reaches its maximum point after months or years. After several more years, the power loss can eventually recover to some degree.
Why Testing Matters
No PV module is expected to operate at peak performance for its full operating lifetime, but it’s known that degradation is highly variable in the field. PVEL’s testing proves LID and LETID vary by BOM.
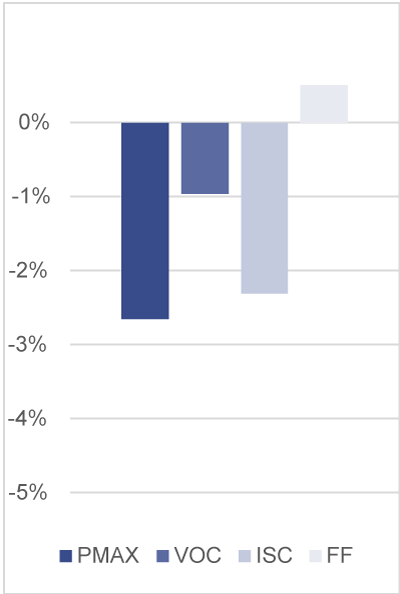
LID
Mono-PERC LID results by dopant from 2016-2021
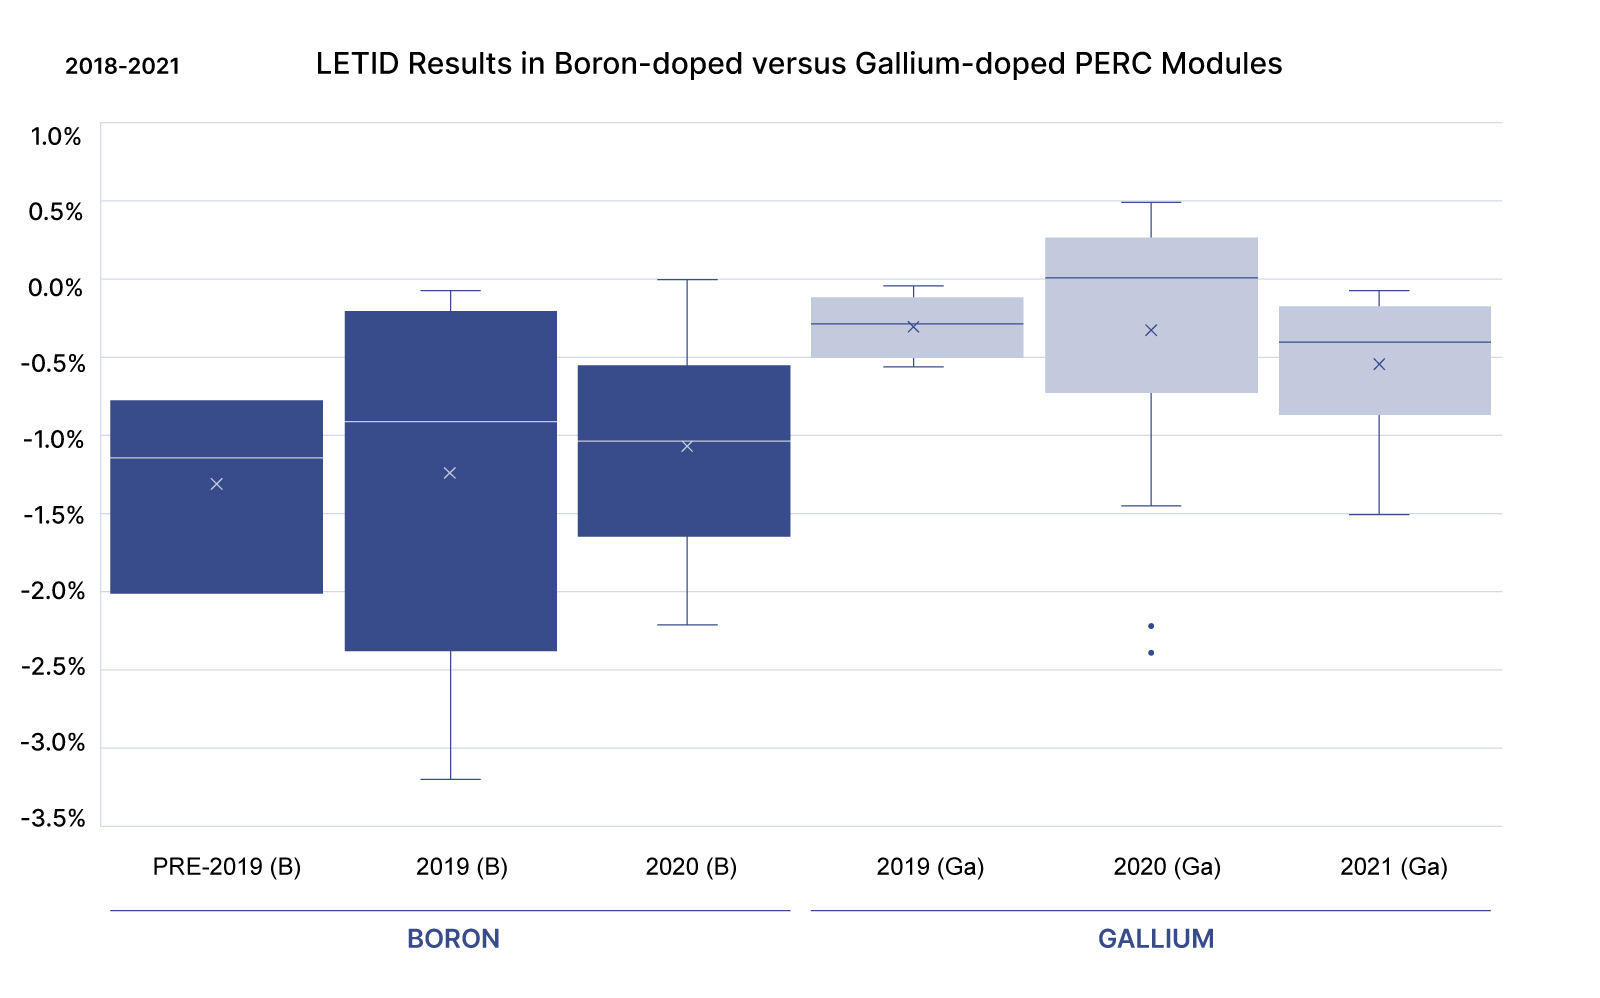
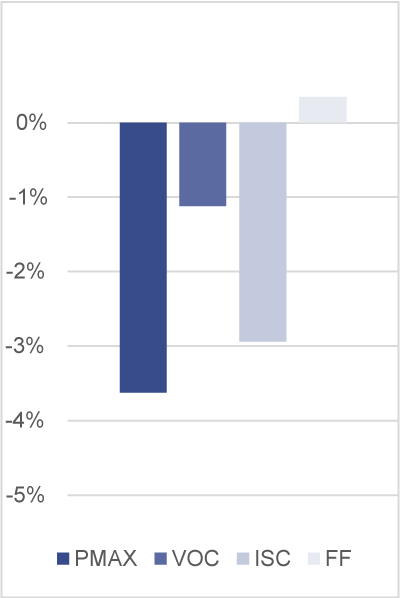
LETID
Mono-PERC LETID results by dopant from 2018-2021
LID
LETID
Overestimating degradation rates when modeling energy yield can reduce project valuations.
Avangrid leverages data from PVEL’s LID and LETID tests to improve performance models. Replacing standardized assumptions with validated degradation rates can increase modeled yields because historically-assumed default values for LID and LETID do not reflect innovative manufacturing advances and cell designs that mitigate degradation.
Accurate energy yield models are the foundation of fair project valuations that drive the deployment of bankable solar PV assets. Avangrid has found benefit in utilizing third-party empirical data when modeling energy yield.
An assumed LID rate of 2% is built into PVsyst energy yield models by default, but PVEL’s testing indicates that doping cells with gallium instead of boron reduces LID and LETID rates.
Source: Emily Greeno, Director, Energy Resources and Meteorology, Avangrid
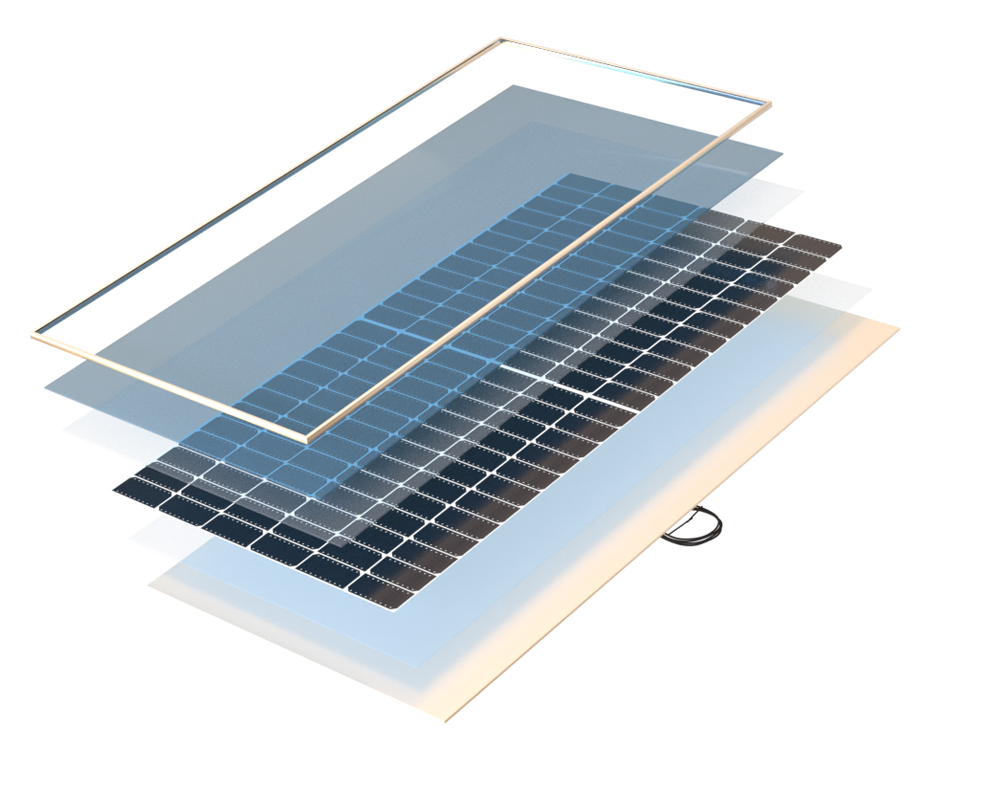
Cells
Key Takeaways
Click through the key takeaways below.
90% of BOMs tested are Top Performers
Almost all BOMs tested in this category were Top Performers this year. Only one BOM had a degradation rate over 3%.
Advancements in cell doping were key to high performance
Improved LID+LETID test results were largely driven by advancements in cell doping, a key step of the manufacturing process for crystalline cells.
Model types can be misleading
Commercially available products sold under the same model type as LID+LETID Top Performers may behave differently in the field. Manufacturers often offer several BOMs to clients with varying performance and cost, so buyers should refer to PVEL’s reports to specify their desired BOMs when negotiating PV module supply contracts.
Test Procedure
To measure LID using PVEL’s outdoor testing protocols, a statistically significant sample of 17 modules are placed outdoors, connected to an inverter and exposed to repeated rounds of light soaking and flash testing until stability is reached per the IEC 61215 criterion.
To measure LETID, two of the post-LID modules are placed in an environmental chamber at 75°C while a low current is injected for 486 hours. This simulates operation in full sun at maximum power point. Modules undergo flash testing and EL imaging every 162 hours. The test protocol is designed to slowly approach the maximum LETID rate so that the recovery process does not affect results, and other degradation modes are not activated.
Power Degradation of Each Model Type
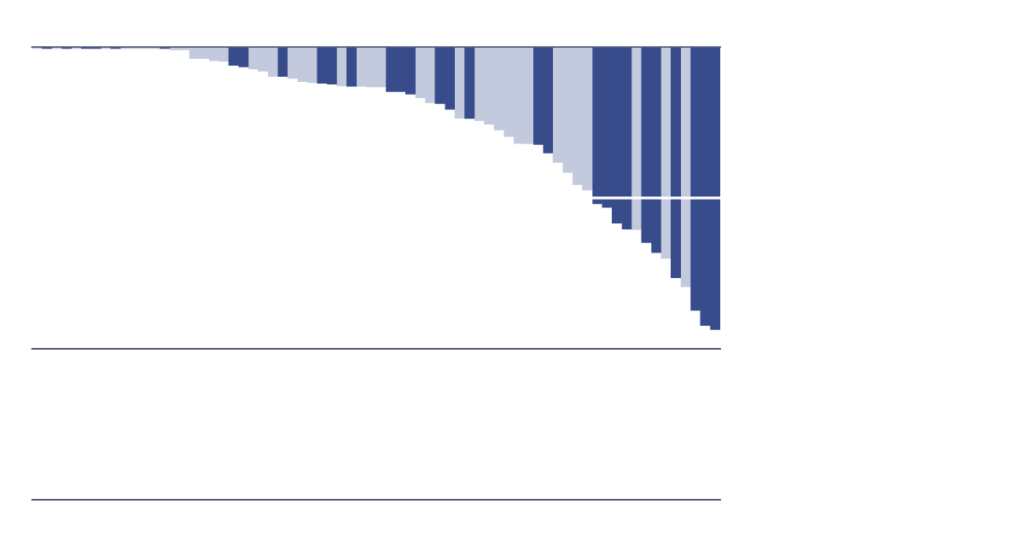
Historical LID+LETID
2022 LID+LETID
Reading LID+LETID Test Results
LID and LETID are measured in terms of power loss. When fielded PV modules exhibit higher rates of either degradation mode, the project will be less profitable.
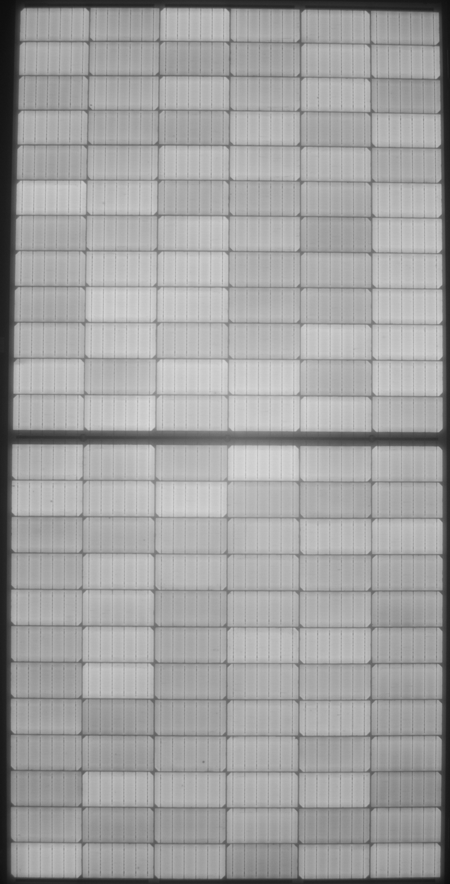
Both LID and LETID produce EL images that look like a checkerboard. This visual signature becomes more prominent as degradation rates rise.
Prestress
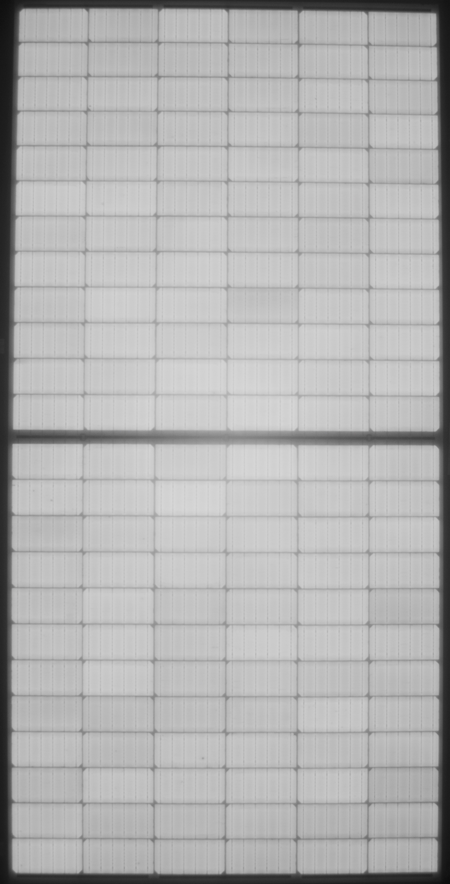
Post Light soak

Post LETID 162

Post LETID 486
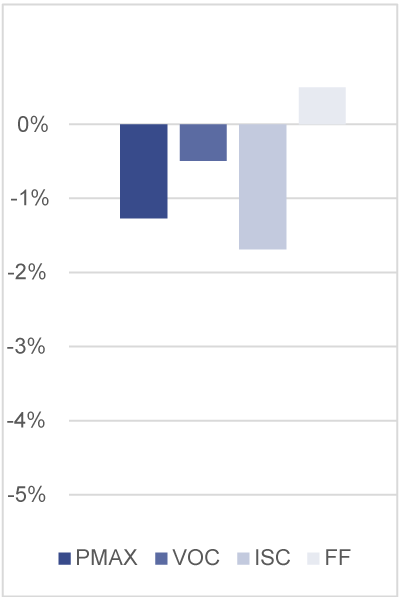
Power Degradation After
LID: 1.27%
LETID162: 2.65%
LETID486: 3.62%
Deviation from Prestress
Deviation from Prestress
Deviation from Prestress
Prestress
Power Degradation After
LID: 1.27%
LETID162: 2.65%
LETID486: 3.62%
Post Light soak
Deviation from Prestress
Post LETID 162
Deviation from Prestress
Post LETID 486
Deviation from Prestress
Go beyond model types. Procure PV modules with top-performing bills of materials.
Join PVEL’s downstream partner network.
Sign Up