PVEL’s PAN files simulate PV module performance in different temperature and irradiance conditions and are used as data inputs for energy models. Using empirical performance data improves energy yield forecast accuracy for all projects, but it is most impactful for extreme environments (e.g., high-temperature or low-irradiance conditions) that are poorly represented by default performance assumptions.
PAN Performance
PAN files model the irradiance- and temperature-dependent behaviors of a PV module. Manufacturer-provided or datasheet-based PAN files may not be based on measured data and therefore may not accurately model the full range of potential irradiance and temperature conditions.
In order to create a more comprehensive PAN file, PVEL assesses performance under numerous irradiance and temperature conditions that can occur in the field. For bifacial modules, the PVEL PAN reports include a “Bifaciality Factor,” or the ratio of the nominal efficiency of the rear side to the nominal efficiency of the front side, as well as other bifacial performance data.
Why Testing Matters
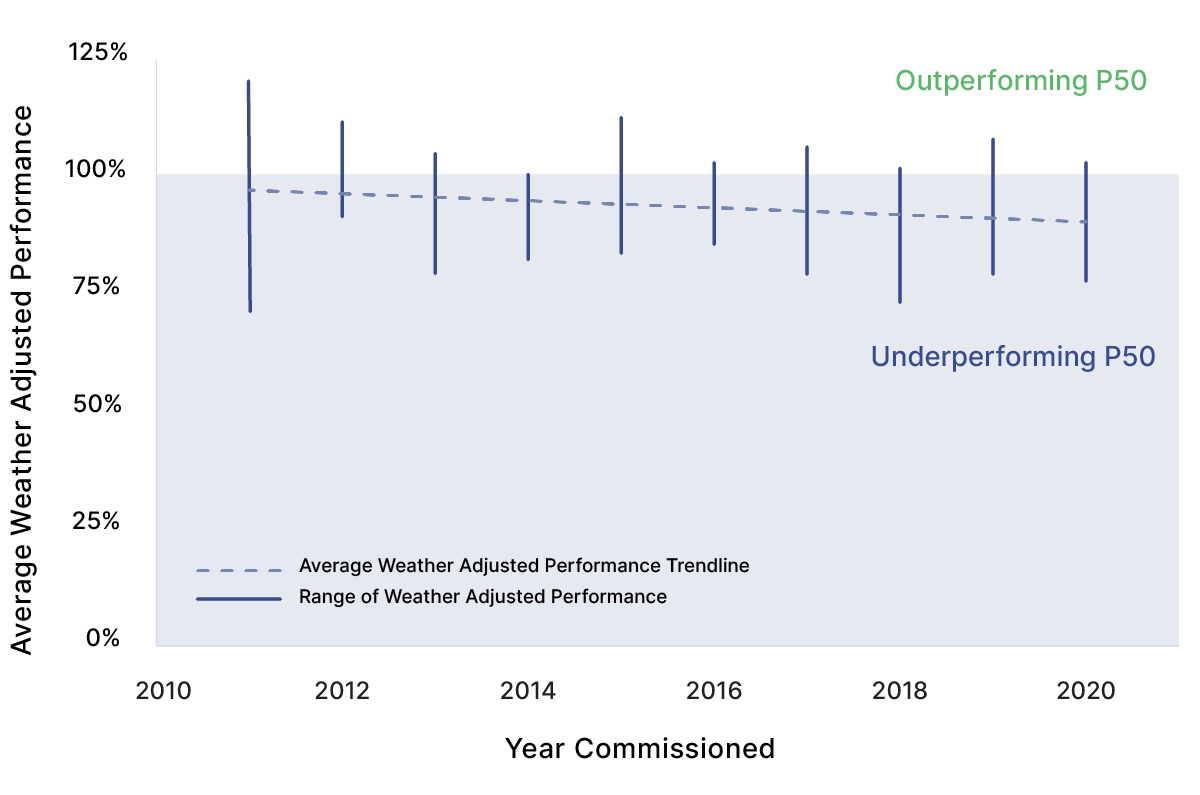
Field data from more than 30% of operating utility-scale solar projects in the U.S. suggests that solar PV assets are underperforming to expectations because energy yield forecasts are becoming more aggressive and less accurate over time.
One in eight projects persistently underperform their P99 estimates, a worst-case scenario for energy yield. Newer projects are more likely to underperform their mid-range P50 estimates than older ones.
P99 and P50 estimates are probabilistic energy yield forecasts developed by independent engineers who typically use the same modeling tools. But they can vary dramatically depending on who is running the model. When key data sets and modeling assumptions such as PAN files and weather data are overstated, an asset may underperform through no fault of the asset manager.
Inaccurate estimates significantly increase the risk of default on solar loans as an asset class.
Long-term asset owners, equity investors and financiers are most exposed. To mitigate risk in future projects, kWh Analytics recommends carefully reviewing model assumptions, utilizing validated data from sources like PVEL, closely vetting all vendors, and procuring production insurance.
Contributed By: Hao Shen, Head of Strategy & Operations, kWh Analytics. These findings are detailed in the Solar Generation Index and the Solar Risk Assessment reports produced by kWh Analytics.
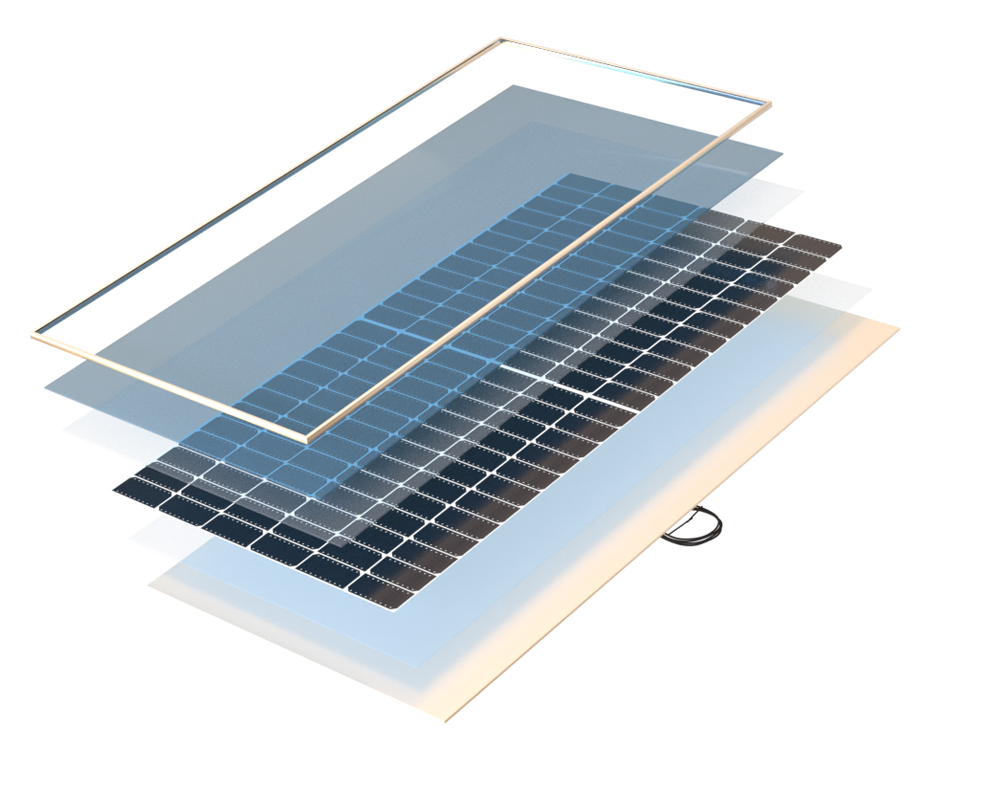
Front Encapsulant
Back Encapsulant
Cells
Backsheet Color
Key Takeaways
Click through the key takeaways below.
All PAN Top Performers are bifacial
The average bifacial model type had a 7% higher specific energy yield than the average monofacial model type for the Las Vegas simulation.
Energy yield is driven by a number of factors
The biggest impacts on bifacial energy yield are a combination of the module temperature coefficients, the manufacturer’s bifacial flash testing/nameplate rating accuracy, and the module bifaciality, which measures rear-side output relative to front-side output. In general, power class, wafer size and module design (e.g., glass//glass versus glass//backsheet) are not drivers of specific energy yield, defined here as energy produced per watt installed.
Low-light performance is becoming consistent
PVEL’s analysis of PAN test results over time reveals that low–light performance is becoming less variable across a range of manufacturers due to increased consistency in cell designs.
Test Procedure
Three module samples are tested across a matrix of operating conditions per IEC 61853-1, ranging in irradiance from 100 W/m2 to 1,100 W/m2 and in temperature from 15°C to 75°C.
PVEL uses the collected data to modify PAN file parameters, resulting in a custom PAN file that has been optimized to reflect PVEL’s measurements across all conditions.
Performance of Each Model Type
To illustrate the impact of PVEL’s PAN files, each PVEL PAN report includes simulations based on PVEL’s PAN files for two sites (a 1 MW site in a temperate climate at a 0° tilt in Boston, USA and a 1 MW site in a desert climate at 20° tilt in Las Vegas, USA).
Historical PAN
2022 PAN


See Top Performers

Low-light Performance and Cell Design
Historically PVEL measured a wide range of low-light performance during PAN testing: it was difficult to predict how a particular module type would respond to low irradiance.
Prior to 2019, the typical cell was 156 mm and module manufacturers used 3, 4, 5 or 6 busbars, a range of cell interconnect sizes and different cell metallization and busbar printing designs. These cell variations could either increase or decrease series resistance, which is directly related to low-light performance.
PV cell and module design has standardized over time. A new norm for large-format cells with similar designs has emerged.
As module and cell designs standardize across manufacturers, low-light performance ranges are narrowing and becoming more predictable.
This transition can be observed in the chart below, which shows a gradual tightening of relative efficiency deviations for low-light performance as manufacturers transition from 156 mm cells to larger formats.

Go beyond model types. Procure PV modules with top-performing bills of materials.
Join PVEL’s downstream partner network.
Sign Up