Potential-induced degradation (PID) is triggered by high PV system voltages on ungrounded systems. PID is more likely to occur in projects that use transformerless inverters, especially in high temperature and high humidity environments. While PID is sometimes reversible, severe and permanent PID can decrease energy yield by as much as 30%.
Potential-Induced Degradation
PID can occur within weeks of commissioning. It generally occurs when there is a negative voltage between a PV module’s frame and cells that causes sodium ions in the PV module’s glass to migrate into the cells which are typically coated with a silicon nitride (SiN) anti-reflective coating. In PID susceptible cells, pinholes in the SiN coating are large enough to allow sodium ions to enter the cell, creating “shunts.” This can cause module performance to be irreparably reduced. Alternatively, a reversible form of PID can occur when the voltage of the PV module’s internal circuit relative to the ground creates a buildup of static charge, also causing power loss.
Why Testing Matters
PID reduces solar profits – even when it is reversible. Kiwa Moroni observed a severe case of reversible PID when conducting technical due diligence on a 1 MW plant in Sicily, Italy in 2019.
By 2019, the solar plant was underperforming by 9.3%, having suffered a 6.3% loss in expected revenues since the project began operating in 2016.
Kiwa Moroni identified PID as the primary driver of project underperformance through desktop analysis of historic energy production data, in-field EL imaging, IR imaging and IV curve tracing.
The firm recommended that the asset owner install an anti-PID device with the expectation that 95% of degradation would be reversed within one year. Despite this recovery the project is expected to be less profitable than modeled by a total of nearly 300,000 Euros over the period from 2016 to 2025.
Asset owners can prevent PID in projects under development by following PVEL’s best practices. While the first step is to procure BOMs that are not susceptible to PID, ongoing testing and inspection throughout the project lifecycle are vital for quickly remediating PID when it occurs.
The IR images show elevated temperatures at the edges of the modules by the frame. This indicates PID, which typically has the highest impact around the perimeter of the PV module.
Contributed by: Loris Morsucci, Operations Director, Kiwa Moroni
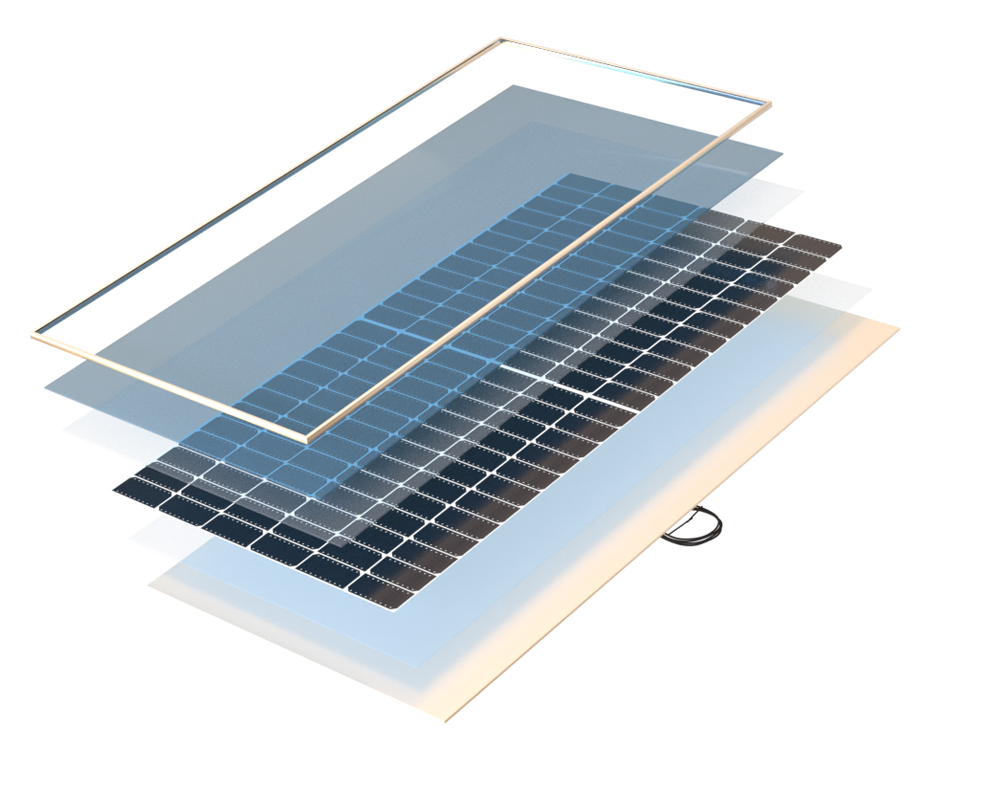
Glass, Glass Coating
Front Encapsulant
Back Encapsulant
Cells
Key Takeaways
Click through the key takeaways below.
77% of BOMs are Top Performers
Results improved markedly as compared to the 2021 Scorecard, which reported the highest mean and median PID rates in PVEL’s history. Yet PID remains an unsolved problem: 5% of BOMs tested for this Scorecard degraded by >8% after PID testing.
Encapsulants are a key material affecting PID susceptibility
While top-performing results were observed in BOMs with EVA encapsulants, BOMs with POE encapsulants were generally less susceptible to PID. 93% of POE BOMs are 2022 Top Performers vs. 72% of EVA BOMs.
Monofacial modules performed slightly better
Average power loss for monofacial modules was slightly lower than the average front-side PID rate for bifacial modules. In contrast to last year’s bifacial test population, front- and rear-side degradation rates of PID were tightly aligned this year.
Test Procedure
A module is placed in an environmental chamber at 85°C and 85% relative humidity for 192 hours while a voltage bias equal to the maximum system voltage rating of the module (typically + and/or − 1500V) is applied. These conditions cause PID to occur in susceptible modules.
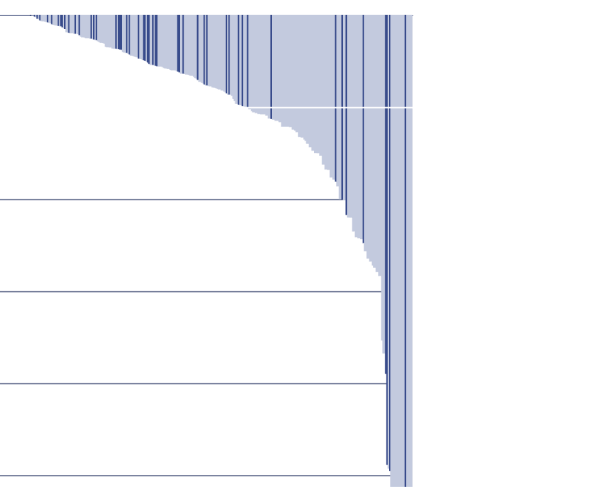
Power Degradation of Each Model Type
Historical PID
2022 PID

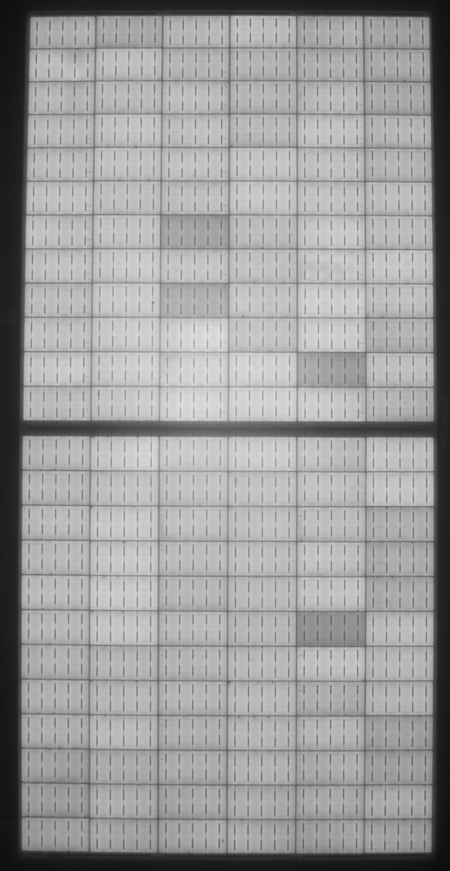
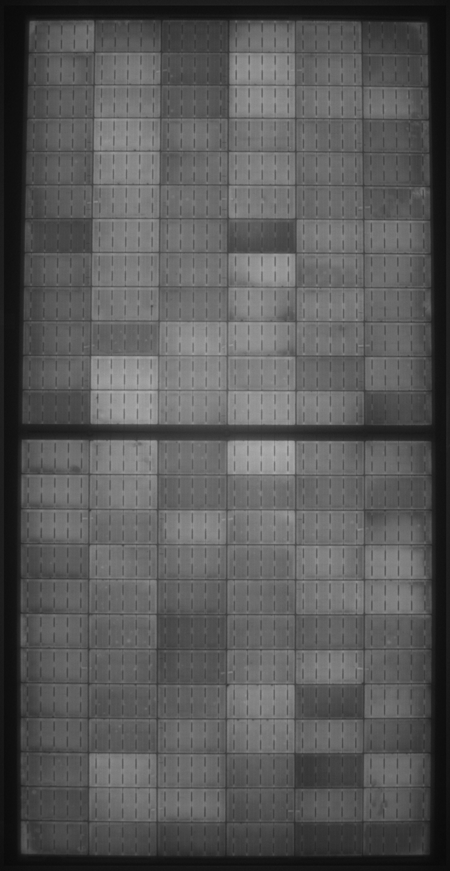
Reading PID Test Results
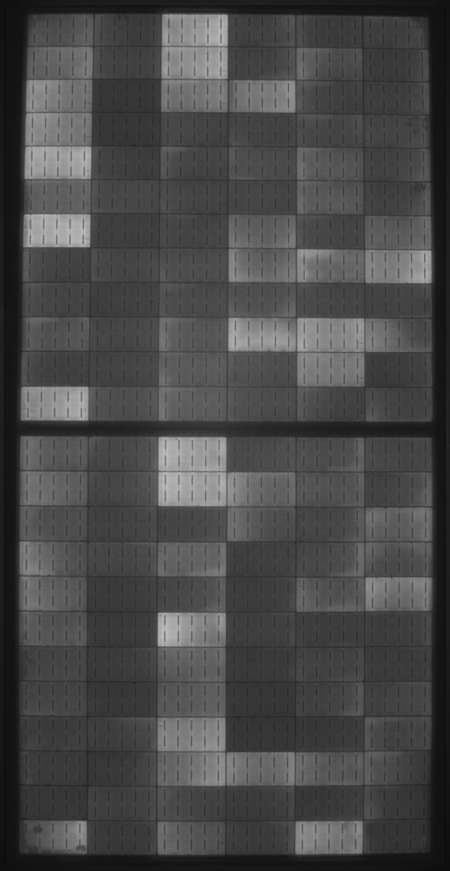
In EL images of PID-susceptible modules, cells on the perimeter often appear dark because leakage current is most likely to occur on the edges of the module. However, PID can result in dark cells in other locations. Severe PID causes the majority of cells throughout the module to appear dark, as shown below.
Prestress
PID96
PID192
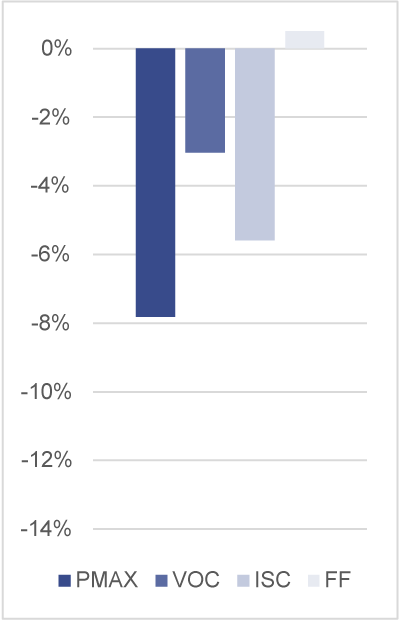
Power Degradation After
96 hours: 7.8%
192 hours: 12.0%
Deviation from Prestress
Deviation from Prestress
Prestress
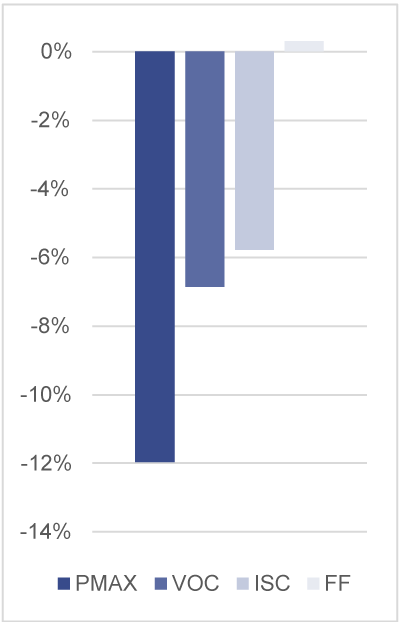
Power Degradation After
96 hours: 7.8%
192 hours: 12.0%
PID96
Deviation from Prestress
PID192
Deviation from Prestress
Go beyond model types. Procure PV modules with top-performing bills of materials.
Join PVEL’s downstream partner network.
Sign Up